Level / selected month
1.61%2026-05
Media evidence for monetary communication
How visible is the central bank when inflation dominates the news?
The Croatian National Bank (Hrvatska narodna banka, HNB) is the focus of this independent study.
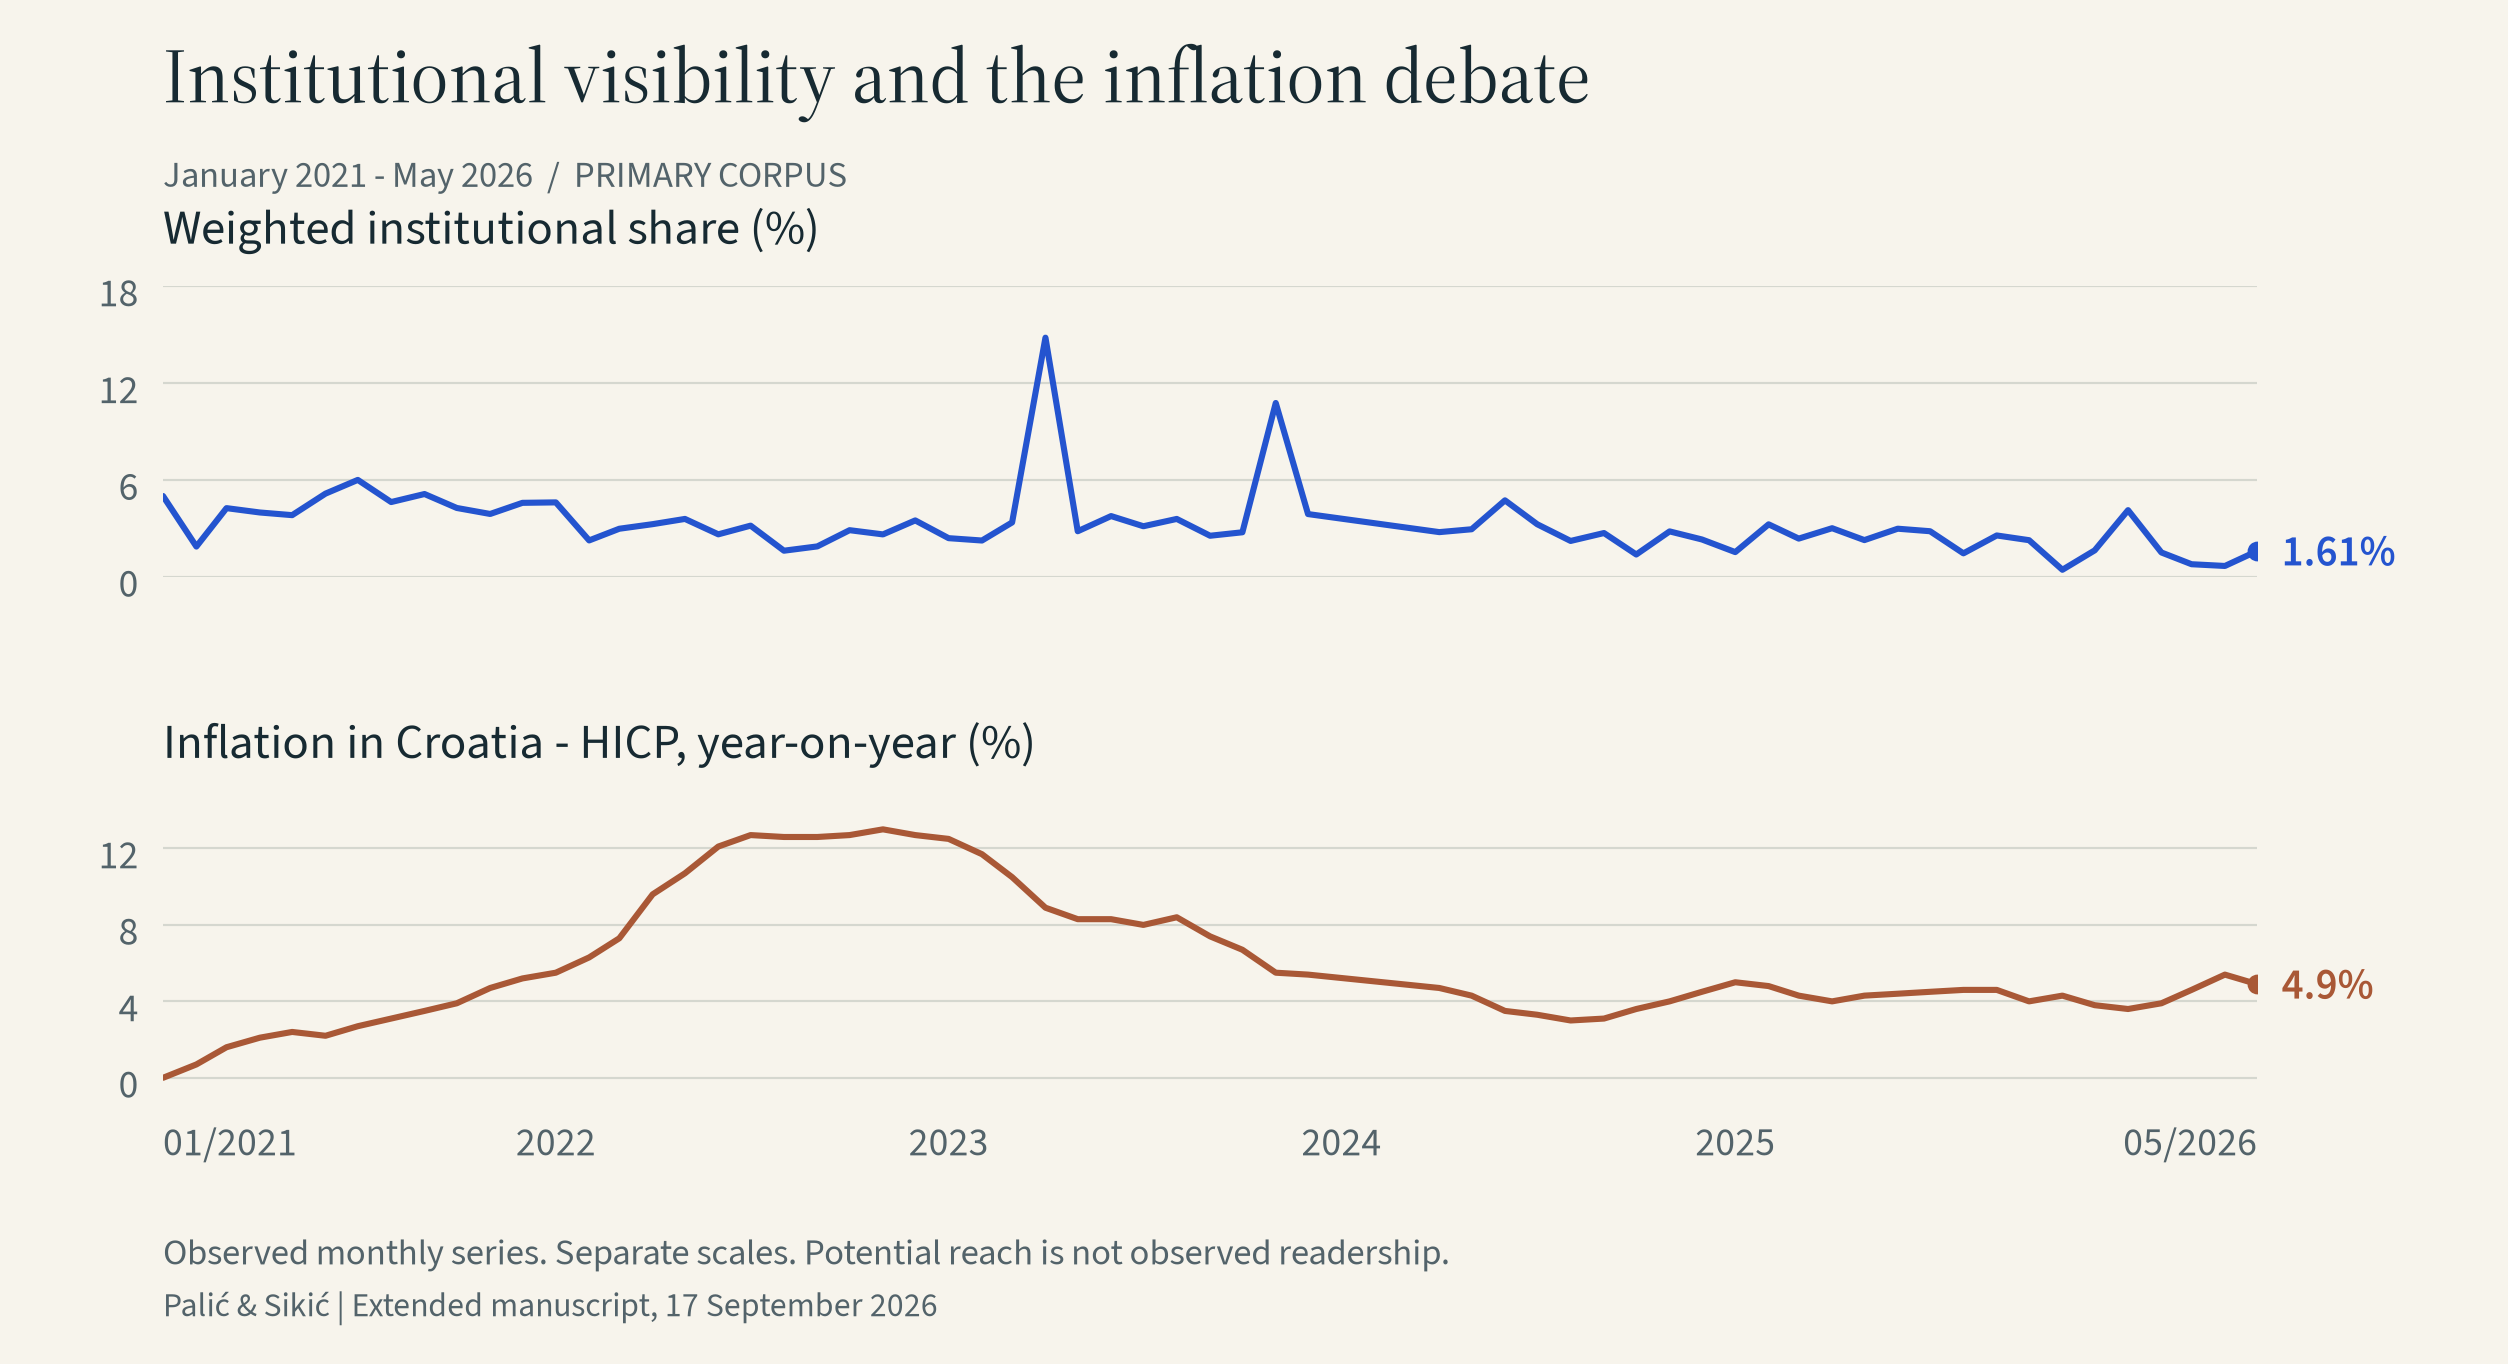
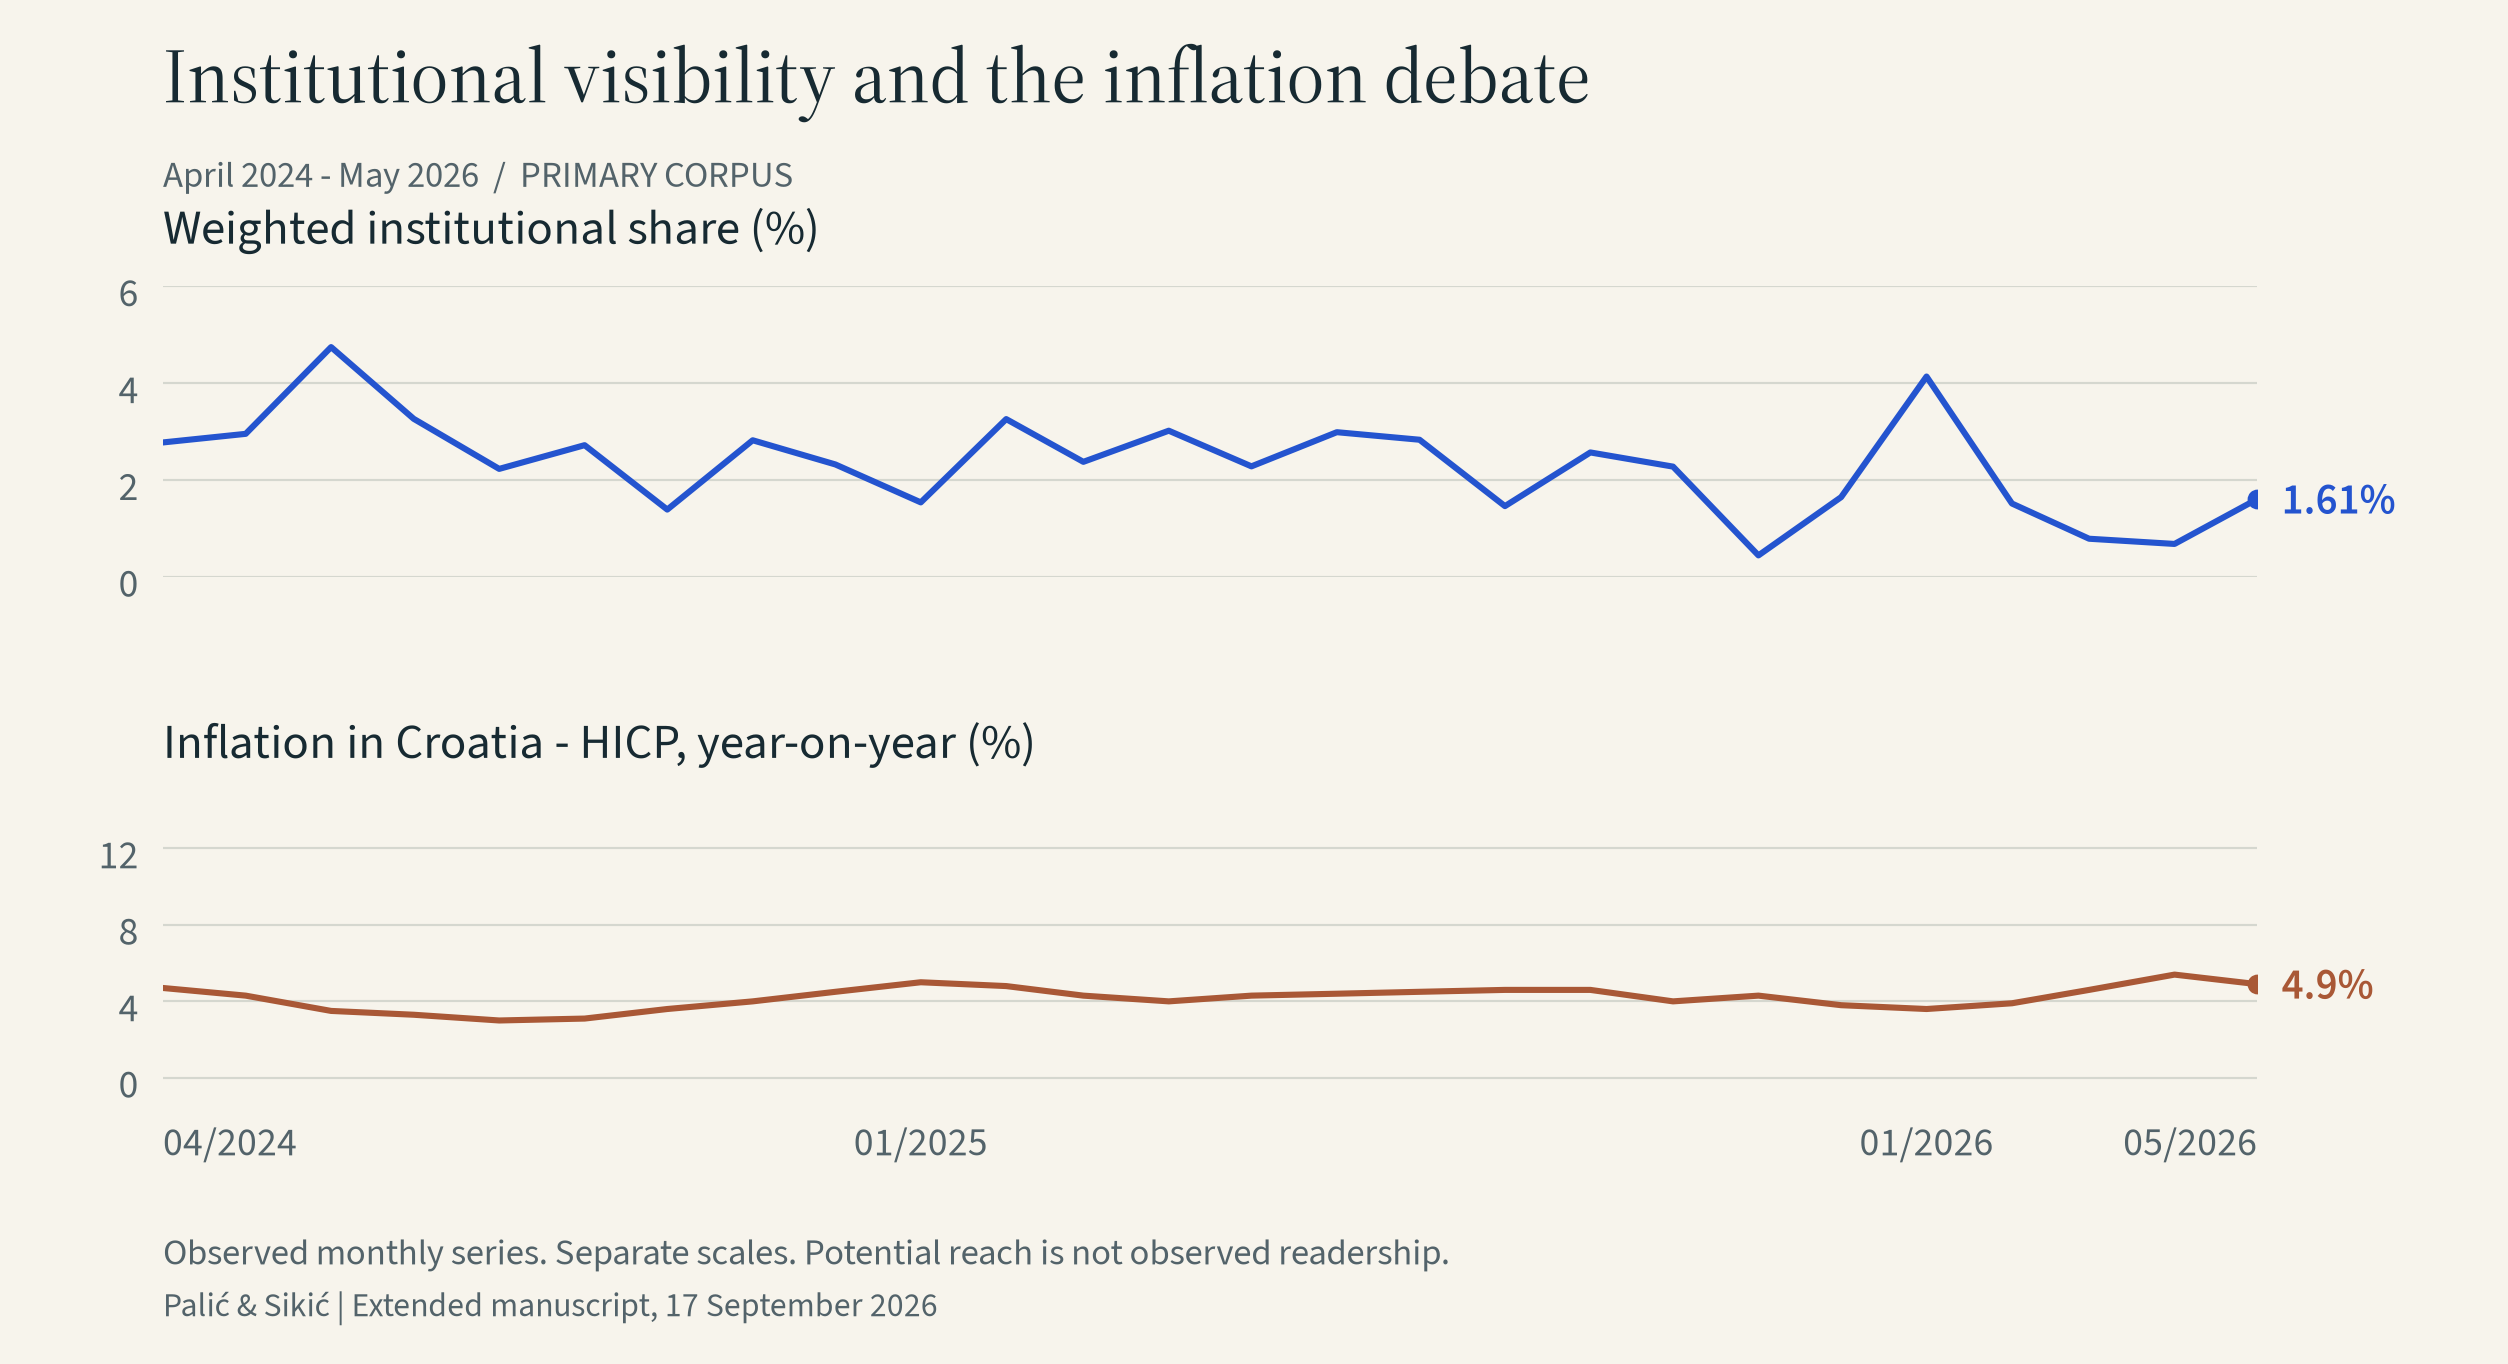
The primary model associates higher inflation with lower weighted institutional visibility. Visibility also declines during April 2024–May 2026. A stable relationship with consumer expectations is not established.
Selected media corpus · associations, not causal effects
The evidence at a glance
Read the findings, or follow each link to the estimates and their interpretation.
The primary model finds a smaller weighted institutional share.
Sensitive to time controls ↗ 02 / Recent patternA downward trend during April 2024–May 2026.
A conditional trend, not a causal effect ↗ 03 / ExpectationsResults depend on the model and survey timing.
Visibility and beliefs are separate measures ↗ 04 / Network positionThe reported centrality interval includes zero.
Network position differs from visibility ↗01 / Explore the evidence
Weighted visibility relates institutional prominence and potential reach to the inflation corpus. It is not readership. Generic central-bank references can also identify the ECB or other institutions.
Choose a question to configure the view, or use the controls below.
Full-history weighted share: 0–18%.
Level / selected month
1.61%2026-05
Direction / endpoints
Compare two monthsEvidence / selected finding
Sensitive to time controlsSee the checks and criteria ↓Saved monthly aggregates · manuscript 17 September 2026.
Media context and source diagnostics · Inspection data · JSON ↓| Month | Share (%) | Gap (pp) | HICP (%) |
|---|---|---|---|
| 2021-01 | 5.02 | -0.99 | 0.0 |
| 2021-02 | 1.88 | 2.14 | 0.7 |
| 2021-03 | 4.26 | -0.24 | 1.6 |
| 2021-04 | 3.99 | 0.03 | 2.1 |
| 2021-05 | 3.83 | 0.20 | 2.4 |
| 2021-06 | 5.16 | -1.14 | 2.2 |
| 2021-07 | 6.01 | -1.99 | 2.7 |
| 2021-08 | 4.64 | -0.62 | 3.1 |
| 2021-09 | 5.14 | -1.11 | 3.5 |
| 2021-10 | 4.27 | -0.25 | 3.9 |
| 2021-11 | 3.90 | 0.12 | 4.7 |
| 2021-12 | 4.59 | -0.57 | 5.2 |
| 2022-01 | 4.62 | -0.60 | 5.5 |
| 2022-02 | 2.26 | 1.76 | 6.3 |
| 2022-03 | 2.99 | 1.04 | 7.3 |
| 2022-04 | 3.27 | 0.75 | 9.6 |
| 2022-05 | 3.60 | 0.43 | 10.7 |
| 2022-06 | 2.64 | 1.38 | 12.1 |
| 2022-07 | 3.18 | 0.85 | 12.7 |
| 2022-08 | 1.63 | 2.40 | 12.6 |
| 2022-09 | 1.89 | 2.13 | 12.6 |
| 2022-10 | 2.90 | 1.13 | 12.7 |
| 2022-11 | 2.64 | 1.39 | 13.0 |
| 2022-12 | 3.50 | 0.52 | 12.7 |
| 2023-01 | 2.40 | 1.62 | 12.5 |
| 2023-02 | 2.26 | 1.77 | 11.7 |
| 2023-03 | 3.38 | 0.65 | 10.5 |
| 2023-04 | 14.83 | -10.80 | 8.9 |
| 2023-05 | 2.83 | 1.19 | 8.3 |
| 2023-06 | 3.77 | 0.25 | 8.3 |
| 2023-07 | 3.14 | 0.88 | 8.0 |
| 2023-08 | 3.60 | 0.43 | 8.4 |
| 2023-09 | 2.55 | 1.47 | 7.4 |
| 2023-10 | 2.77 | 1.26 | 6.7 |
| 2023-11 | 10.78 | -6.75 | 5.5 |
| 2023-12 | 3.90 | 0.13 | 5.4 |
| 2024-04 | 2.78 | 1.25 | 4.7 |
| 2024-05 | 2.96 | 1.07 | 4.3 |
| 2024-06 | 4.75 | -0.72 | 3.5 |
| 2024-07 | 3.27 | 0.76 | 3.3 |
| 2024-08 | 2.23 | 1.79 | 3.0 |
| 2024-09 | 2.72 | 1.30 | 3.1 |
| 2024-10 | 1.39 | 2.63 | 3.6 |
| 2024-11 | 2.82 | 1.20 | 4.0 |
| 2024-12 | 2.32 | 1.70 | 4.5 |
| 2025-01 | 1.54 | 2.49 | 5.0 |
| 2025-02 | 3.26 | 0.77 | 4.8 |
| 2025-03 | 2.38 | 1.65 | 4.3 |
| 2025-04 | 3.02 | 1.00 | 4.0 |
| 2025-05 | 2.28 | 1.74 | 4.3 |
| 2025-06 | 2.99 | 1.04 | 4.4 |
| 2025-07 | 2.83 | 1.19 | 4.5 |
| 2025-08 | 1.46 | 2.56 | 4.6 |
| 2025-09 | 2.57 | 1.45 | 4.6 |
| 2025-10 | 2.28 | 1.75 | 4.0 |
| 2025-11 | 0.45 | 3.58 | 4.3 |
| 2025-12 | 1.65 | 2.38 | 3.8 |
| 2026-01 | 4.14 | -0.11 | 3.6 |
| 2026-02 | 1.52 | 2.51 | 3.9 |
| 2026-03 | 0.79 | 3.24 | 4.6 |
| 2026-04 | 0.68 | 3.34 | 5.4 |
| 2026-05 | 1.61 | 2.42 | 4.9 |
Inspect / compare
An endpoint difference is descriptive. It is not a fitted trend, a significance test or a policy-performance score. Changing the series definition recalculates both endpoints.
“Sensitive to time controls”: a displayed time-control interval includes zero. “Same direction across source definitions”: primary and common-source trend estimates point the same way; interval precision is reported separately. “Depends on survey assignment”: the reported future horizons differ across assignments. “Direction uncertain”: the reference centrality interval includes zero. These labels summarise the named checks; they are not confidence grades. Related models are not independent votes.
02 / Understand the measure
The study weights institutional items by their estimated potential reach and how prominently the institution appears. It compares that total with potential reach across monitored inflation coverage. This is a constructed weighted share, not the proportion of people paying attention or a simple percentage of articles.
Relative visibility can fall even when institutional coverage stays unchanged, if the wider inflation discussion grows faster. That is a possible mechanism to investigate, not a decomposition established by the headline model.
Illustration · hypothetical values
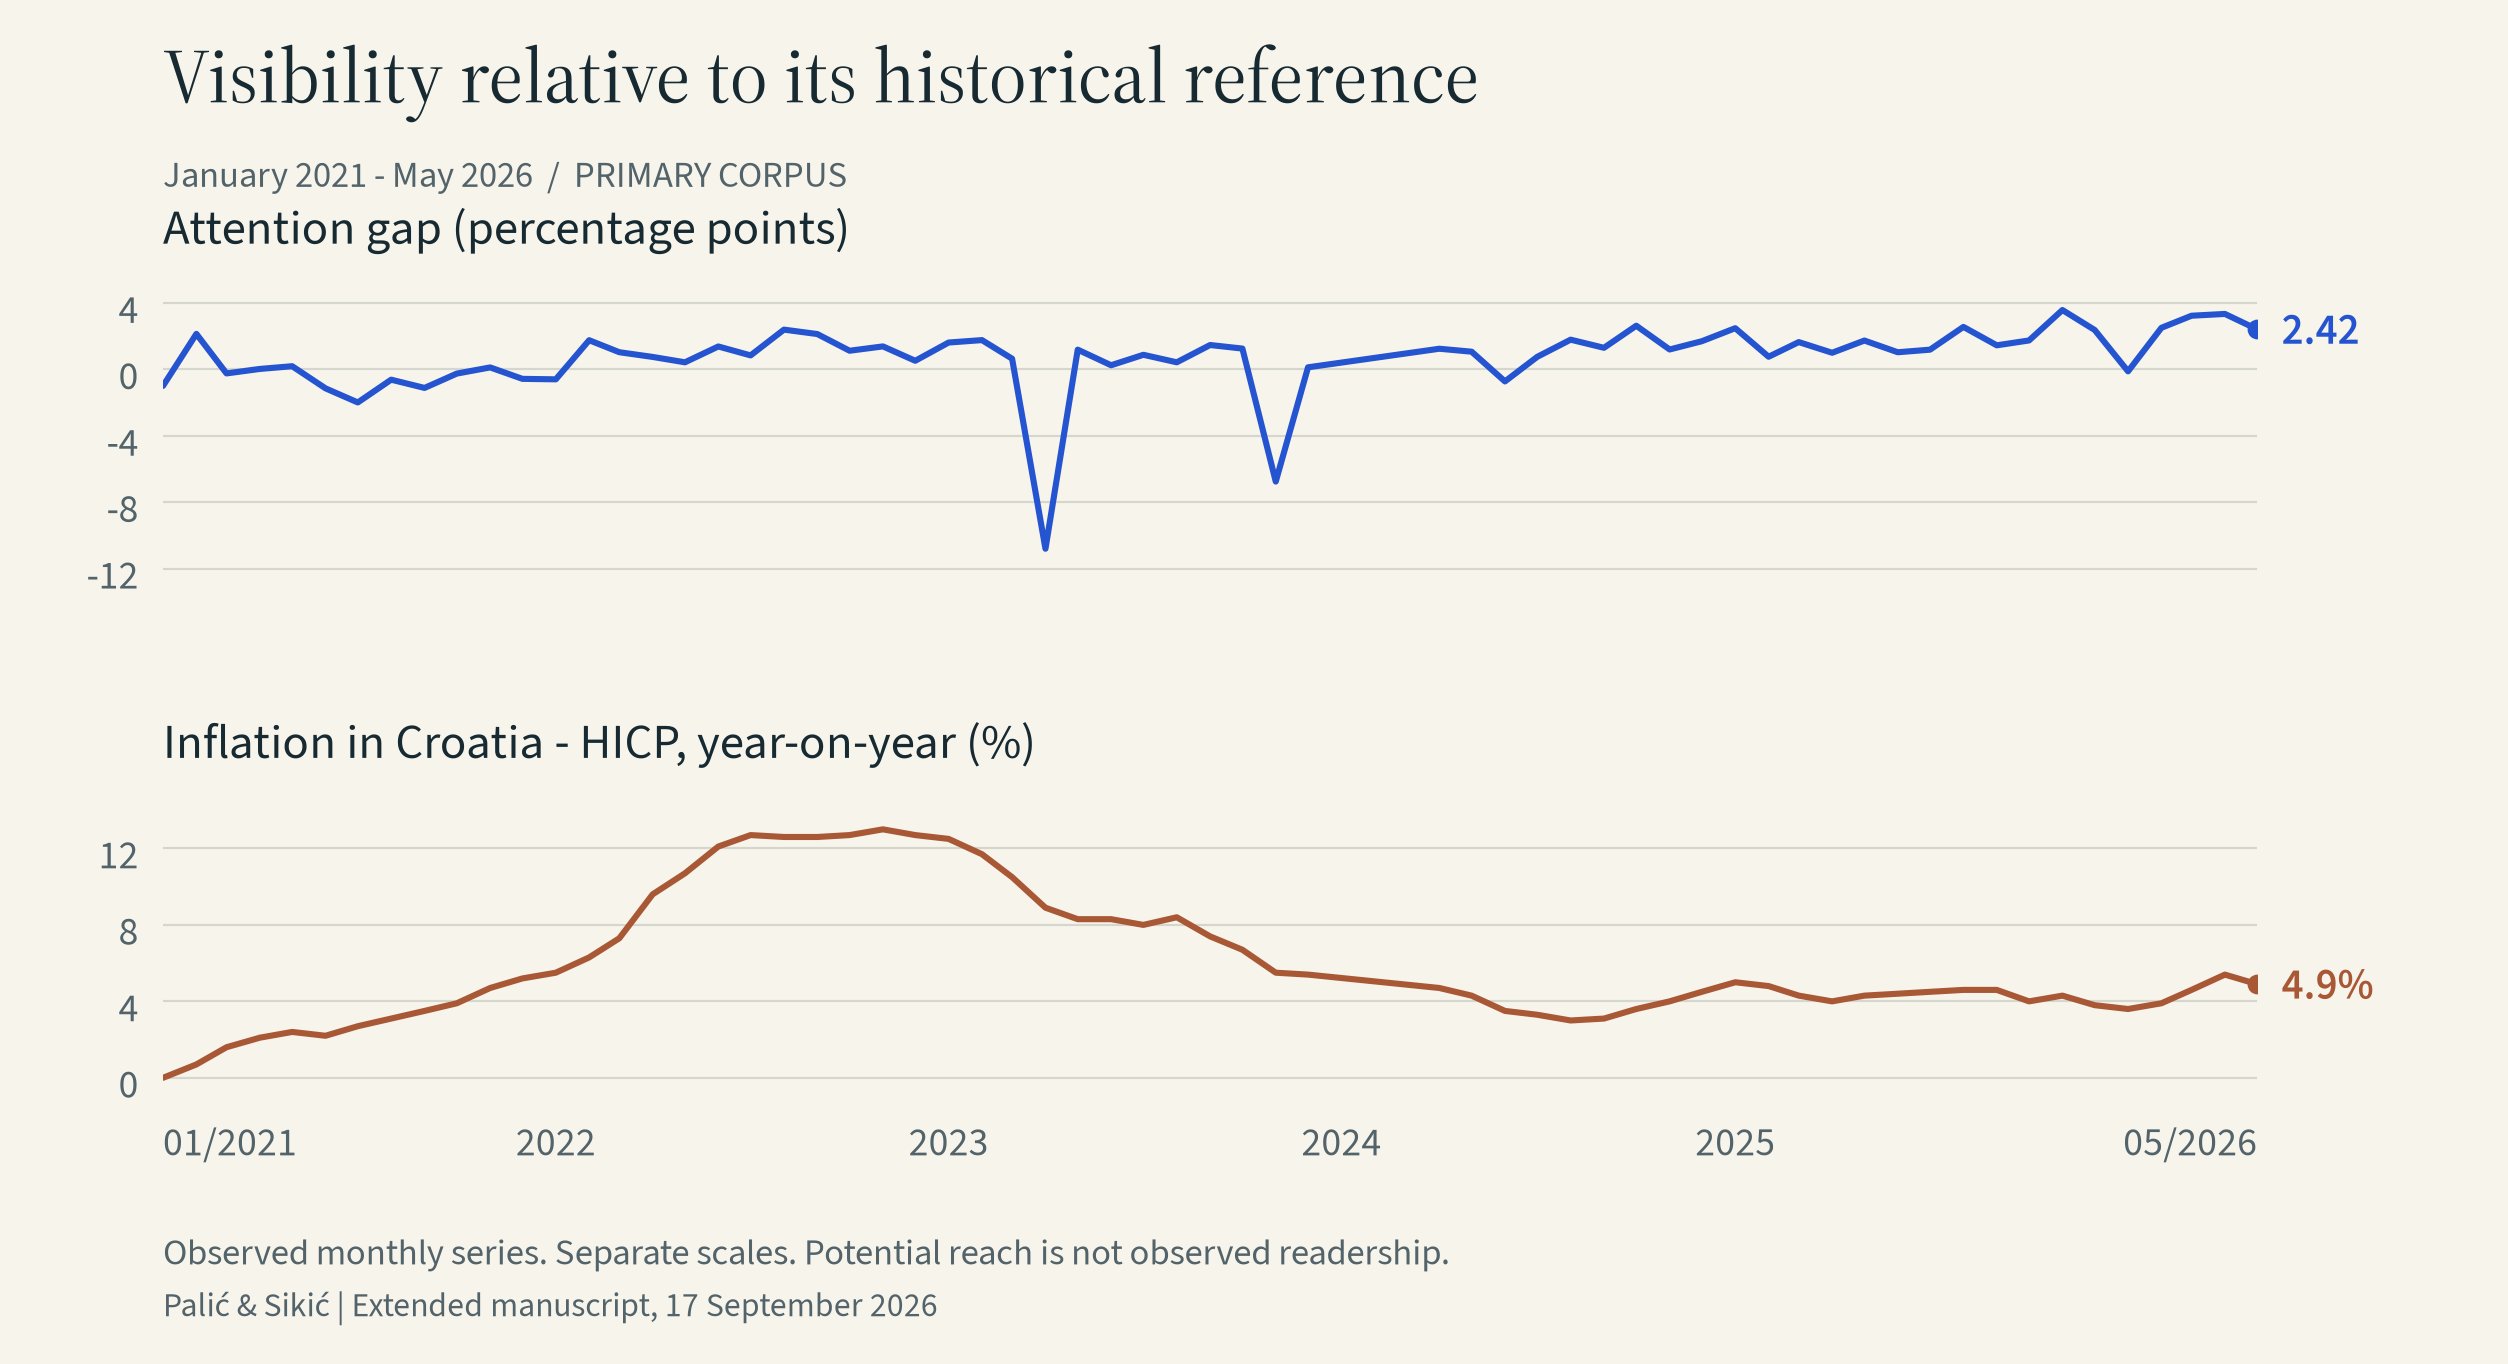
A larger gap means a smaller relative share. Zero marks a historical reference, not a communication target. The chart defaults to the share itself: up means more visibility.
How the measure is constructed ↓Indicator overview
Relevance selects → prominence and reach weight → visibility measures.
The gap transforms visibility. Centrality and expectations answer separate questions.
Worked example / hypothetical items and component scores
All three invented items concern inflation and each has 1,000 potential-reach units. The component scores below are chosen for illustration; the weighting formula is the study’s actual rule (Appendix A2).
| Illustrative item | Component scores | Institutional contribution |
|---|---|---|
| Institution in the headline and quoted | 1 / 0.9 / 0.8 / 1 | 0.935 × 1,000 = 935 |
| Institution mentioned briefly | 0 / 0.2 / 0.1 / 0 | 0.070 × 1,000 = 70 |
| Inflation story without an institutional reference | No institutional contribution | 0; reach enters the denominator |
For example, 0.30 × 1 + 0.25 × 0.9 + 0.20 × 0.8 + 0.25 × 1 = 0.935. Doubling this item’s potential reach would double its weighted institutional contribution, holding salience fixed.
In this separate illustration, denominator units already include the formula’s +1. Visibility halves when the wider debate doubles while institutional coverage stays fixed. This demonstrates arithmetic, not a mechanism established by the observed results.
What “HNB” means in this dataset. The matching rules include generic central-bank terms, so some items may refer to the ECB or other institutions. The indicator describes the selected institutional corpus; it is not a verified count of HNB’s own messages or of people who read them.
Media environment / study scope
Recorded institutional items across these channel labels: Web, Facebook, Youtube, Forums, X / Twitter, Reddit, Comments, Instagram, Tiktok. Web items dominate this corpus. The visibility numerator uses inflation-relevant institutional items; its denominator uses the monitored inflation corpus. Dates: January 2021–May 2026.
A publisher’s website is an online source even when its brand also operates television or print. This corpus measures publication instances rather than population-wide news consumption.
Reach summed across items is an additive weight, not a count of unique people. Audiences and repeated stories can overlap.
Selected-month diagnostics
Domain labels are shown alphabetically by default. A domain, news brand and ownership group are different units. The shares below describe contributions to the institutional numerator, not quality, independence or audience market share.
The five-source and ten-item shares use all contributing source labels and items. The table lists domain-form labels with relevant items. Publication instances are not deduplicated story counts; repeated distribution does not by itself demonstrate independent editorial attention.
03 / Three takeaways
Estimates matched to saved outputs of the extended draft. Research models were not re-estimated for this page.
−0.21
percentage points of weighted share
per +1 percentage point of inflation
The association is sensitive to time controls; it does not establish causality.
A 1 percentage-point higher HICP inflation rate is associated with a 0.21 percentage-point lower weighted share in the primary weekly model.
95% interval for the decline: 0.11 to 0.31 percentage points per +1 percentage point of inflation.
For HNB: the size of the inflation debate and the bank’s share of it answer different questions.
Section 4.2 · Table 6 · equations 8 and 9b
−0.076
percentage points of weighted share per month
April 2024–May 2026
This is a within-period association, not evidence that disinflation causes lower visibility.
The weighted institutional share declines by 0.076 percentage points per month after accounting for inflation and the other regressors.
95% interval for the decline: 0.035 to 0.118 percentage points per month.
For HNB: assess the coverage of monetary explanations even after the initial inflation surge has passed.
Section 4.6 · within-source trend · page 13
No stable link
Consumer expectations · separate outcome
Some horizons are significant under other specifications. The survey balance does not measure long-term anchoring or trust.
Forward projections of consumer expectations depend on how monthly survey information is assigned to weeks and which controls are used. They do not robustly establish a persistent predictive channel.
Survey timing and model controls change the comparisons.
For HNB: read media visibility alongside survey evidence; one cannot substitute for the other.
Section 4.5 · Table 8 · Figure 5
The immediate contribution is a diagnostic of media representation. Decisions about message quality, audience understanding or communication effectiveness need evidence beyond this indicator.
04 / What this means for HNB
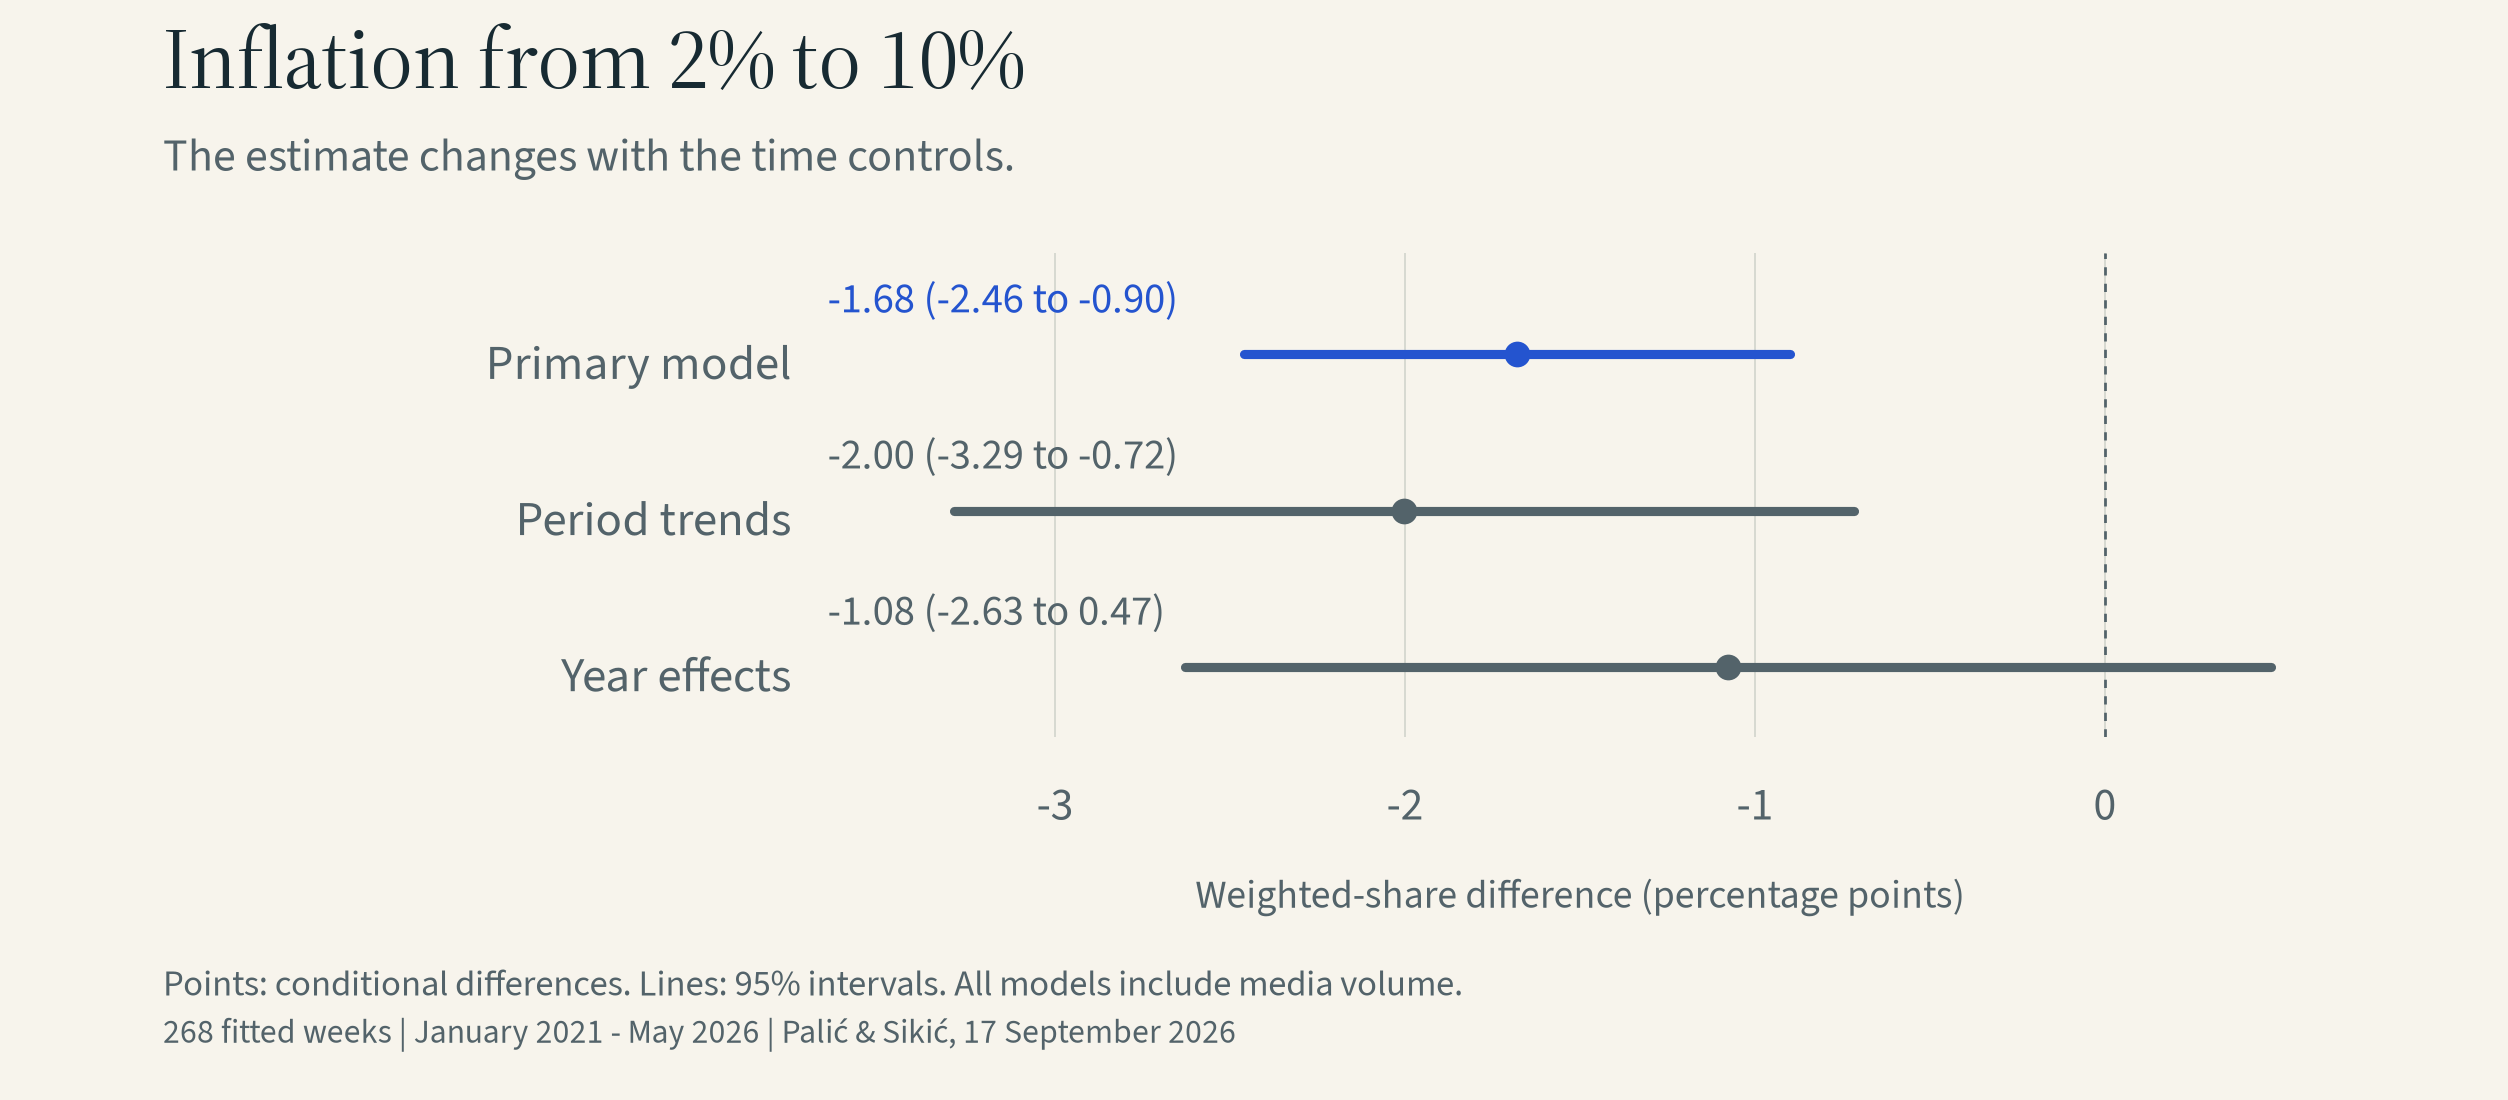
−1.68 percentage points
This is the paper’s conditional comparison: hold the model’s other variables fixed and change only inflation. The primary weekly estimate implies a 1.68 percentage-point smaller weighted share (95% interval: 0.90 to 2.46).
That is a change in the constructed share of media coverage, not a 1.68% fall in readership. The chart shows how the estimate changes when trends or year effects are added.
The study distinguishes the share of relevant articles from their prominence and reach. More statements or more mentions can coexist with a smaller share of a growing debate. The results do not isolate a single cause of that change.
Paper: Section 4.3 and discussion.
Visibility asks how much of the debate the institution occupies. Network centrality asks how centrally it sits among the actors linked through media sources, giving more weight to connections with well-connected actors.
Using common sources, the later monthly centrality trend is -0.0051 index units (95% interval -0.0129 to 0.0027; p = 0.187). The interval includes zero: a lasting loss of network position is not established.
Paper: Section 4.7 and Appendix B2; 25 fitted months.
For the article-share measure, the baseline weekly projections find no significant future horizons with linear survey interpolation, but find weeks 1–2 with step assignment. The monthly comparison finds month 12. Controls also change the results.
The paper therefore does not establish that a wider media gap causes expectations to become unanchored.
Paper: Section 4.5 and Appendix A12; corrected comparisons.
A practical investigation agenda
These are proposals for investigation. The findings do not establish that a particular communication campaign would improve understanding or expectations.
For the governor, the useful distinction is between what HNB publishes, how it appears in the wider debate, and what households understand. The paper measures the middle of that relationship. Its visibility indicator complements communication and survey evidence; it is not a target to maximise.
05 / For a closer look
A one-percentage-point higher inflation rate, for example 4% rather than 3%, is associated with the change in the gap shown below. The identical association in weighted visibility has the opposite sign. This is not a change in the number of readers.
Associated increase in the gap
0.21 percentage points
95% confidence interval: 0.11 to 0.31 percentage points
This interval is above zero.
268 fitted weeks · January 2021–May 2026
Sample S1 · equation 9b · Newey–West intervals · p < 0.001
The volume control counts media items, not HNB-issued communications. Weekly inflation repeats monthly information; these are not 268 independent inflation readings. Changing the volume control is not a mediation estimate.
Compare the primary models with additional trends or year effects. All rows below include the media-volume control and use the same gap units.
The weekly year-effect and monthly trend-control intervals include zero. A positive point estimate does not establish independence from shared time patterns. These are saved comparisons, not every possible combination of controls.
| Observations | Time controls | Estimate | 95% CI |
|---|---|---|---|
| Monthly | Primary | 0.175 | 0.052 to 0.298 |
| Monthly | Period trends | 0.179 | -0.028 to 0.386 |
| Monthly | Year effects | 0.197 | 0.008 to 0.385 |
| Weekly | Primary | 0.210 | 0.113 to 0.307 |
| Weekly | Period trends | 0.250 | 0.090 to 0.411 |
| Weekly | Year effects | 0.135 | -0.059 to 0.329 |
The controlled monthly gap trend is +0.076 percentage points per month (95% CI 0.035 to 0.118; 25 fitted months). This corresponds to a declining weighted share. Among common sources the trend is +0.056 pp per month (p = 0.045).
The comparison describes April 2024–May 2026. It does not establish that falling inflation causes lower visibility.
The survey is monthly. Assigning values to weeks in different ways does not create new weekly responses. A linear assignment moves gradually between monthly values; a step assignment holds a monthly value across its weeks. Results also change with the control set.
For the article-share margin in the primary sample, the saved baseline comparisons are:
The correction includes 13 horizons per family, including the contemporaneous one. These counts summarise specification sensitivity, not effect size or practical importance. The survey balance describes expected price movements, not long-term anchoring or trust. No stable predictive channel or validated forecasting tool is established.
Centrality describes position in the network linking media sources and actors. It is normalised relative to the other actors each month, so changes in network composition can alter the score. The common-source monthly trend is -0.0051 index units per month, with a 95% interval from -0.0129 to 0.0027. The interval includes zero. This does not establish lasting structural erosion, and the score is not a measure of credibility, trust or policy influence.
Read the interpretation for HNB ↑06 / Methods & limits
A positive gap means lower visibility than the baseline. A negative gap means higher visibility. Zero marks that reference, not an ideal level of communication.
The displayed monthly baseline is 4.026%: the mean weighted share in January–June 2021 after excluding baseline observations more than two standard deviations from the initial mean. Monthly and weekly baselines are calculated separately.
The numerator adds potential reach weighted by institutional salience for inflation-relevant items in the HNB corpus. The denominator adds reach across the inflation corpus, plus one. Salience combines title presence, first-mention position, mention frequency and institutional agency cues.
Formal names, acronyms and generic central-bank terms identify the institutional corpus. Generic terms can include other central banks, including ECB or Eurosystem coverage after euro adoption. The measure does not cleanly isolate every HNB message. HNB-specific, ECB/Eurosystem and ambiguous references have not been independently validated as separate categories.
The analysis covers January 2021–May 2026. The main regressions use 60 monthly or 268 weekly observations. This is a selected vendor corpus, not a complete census of Croatian media or a representative audience sample.
Recorded dates provide the time basis. Generic institutional terms can capture the ECB or other central banks. The indicator is distinct from HNB’s own publication output.
Estimate uncertainty: the reported 95% intervals use the saved Newey–West estimates with Bartlett weights, bandwidth floor(N1/3) and no prewhitening. They describe statistical precision conditional on the selected model.
Model sensitivity: different time controls, media-volume controls and survey assignments can change the estimates. Compare specifications in the evidence section.
Measurement uncertainty: institutional classification, potential reach and vendor sentiment are proxies. The model intervals do not quantify every possible measurement error.
The baseline models include inflation changes, euro adoption, source-reach concentration and vendor negative sentiment alongside the manuscript’s other controls. Equation 9b also includes log HNB-corpus volume. Weekly macroeconomic values are assigned from the month of the week’s start. Public estimates reproduce saved outputs; this publication does not re-estimate the models.
Potential reach is not observed reading, exposure, trust or understanding. Vendor sentiment is not independently validated on this corpus. The gap is neither a count of HNB statements nor a score of communication quality. No threshold for policy-relevant deterioration or monetary welfare cost is established.
HANFA comparisons and instrument diagnostics do not establish an HNB-specific causal mechanism. Forward expectation results depend on interpolation and controls. Media evidence alone cannot establish anchoring of expectations or changes in individual beliefs.
The older paper’s abstract, table and recalculated initial-sample coefficients do not all agree. The extended draft reports this unresolved discrepancy; it does not claim exact legacy replication.
Manuscript edition: 17 September 2026. Primary analytical sample: January 2021–May 2026. Latest included month: May 2026. Website built: 2026-09-21.
This is a static publication of one study, not a continuously updated monitoring service. The public dataset contains only the selected aggregate series and model results. Later exploratory periods and future research are outside this edition.
07 / Research & downloads
Two pages covering January 2021–May 2026: the full visibility and inflation timeline, the principal estimate and its uncertainty, with concise findings on trends, centrality and expectations.
English brief ↓Sažetak na hrvatskom ↓Od inflacijskog vala do dezinflacije: institucionalni jaz u pažnji HNB-a 2021.–2026.
Petra Palić · Luka Sikić
17 September 2026 · Author review pending
Monthly aggregates · CSV ↓
Finding records · JSON ↓
Observations and estimates · JSON ↓
Interaction code · JavaScript ↓
Chart rendering code · JavaScript ↓
Hrvatsko katoličko sveučilište
Authors of the extended study combining media measurement, time-series analysis and specification checks. The paper documents the methods and their limits. This is an independent research presentation; no HNB partnership or endorsement is claimed.
Research status
2026-09-19.3: redesigned bilingual briefs, full January 2021–May 2026 timelines, matching downloadable figures and on-site readers.
2026-09-19.2: question-based views, contextual indicator inspection, direct sensitivity comparisons, source concentration diagnostics and traceable finding records.
2026-09-19.1: evidence overview, indicator guide, worked examples, shareable selections, selected-view exports and clearer interval interpretation.
17 September 2026: extended manuscript edition underlying the saved estimates.
Palić, P., & Sikić, L. (2026). Pasivno zamijenjena: cijena inflacije koju ne mjeri indeks potrošačkih cijena. Extended research draft, 17 September 2026. Hrvatsko katoličko sveučilište.
Download citation ↓The source is the extended manuscript edition of 17 September 2026. Earlier reported and recalculated coefficients do not all agree; exact replication of the earlier paper remains unresolved. The findings here refer to saved outputs of this extended edition. No publication venue or DOI is claimed.
Traceable findings / edition 2026-09-17
Each identifier refers to a fixed research finding. The controls above change the view; they do not rewrite its reference model.
Palić & Sikić (2026), F1: Higher inflation is associated with lower weighted visibility in the primary weekly model; time-control sensitivity qualifies the association. Extended manuscript, 17 September 2026.
Palić & Sikić (2026), F2: Weighted visibility declines within April 2024–May 2026 in the primary and common-source monthly trend models. Extended manuscript, 17 September 2026.
Palić & Sikić (2026), F3: A stable predictive relationship with consumer expectations is not established; survey assignment and model controls affect the results. Extended manuscript, 17 September 2026.
Palić & Sikić (2026), F4: The common-source monthly centrality interval includes zero; a lasting decline in network position is not established. Extended manuscript, 17 September 2026.
Finding records and revision history · JSON ↓ · Supporting values and comparisons · JSON ↓
2026-09-19.3 · Editorial and evidence presentation. Redesigned both two-page briefs, added the full January 2021–May 2026 timeline and updated the downloadable figures and on-site readers. The published research estimates and their methods are unchanged.