Page 1 / 2
Open full-size page ↗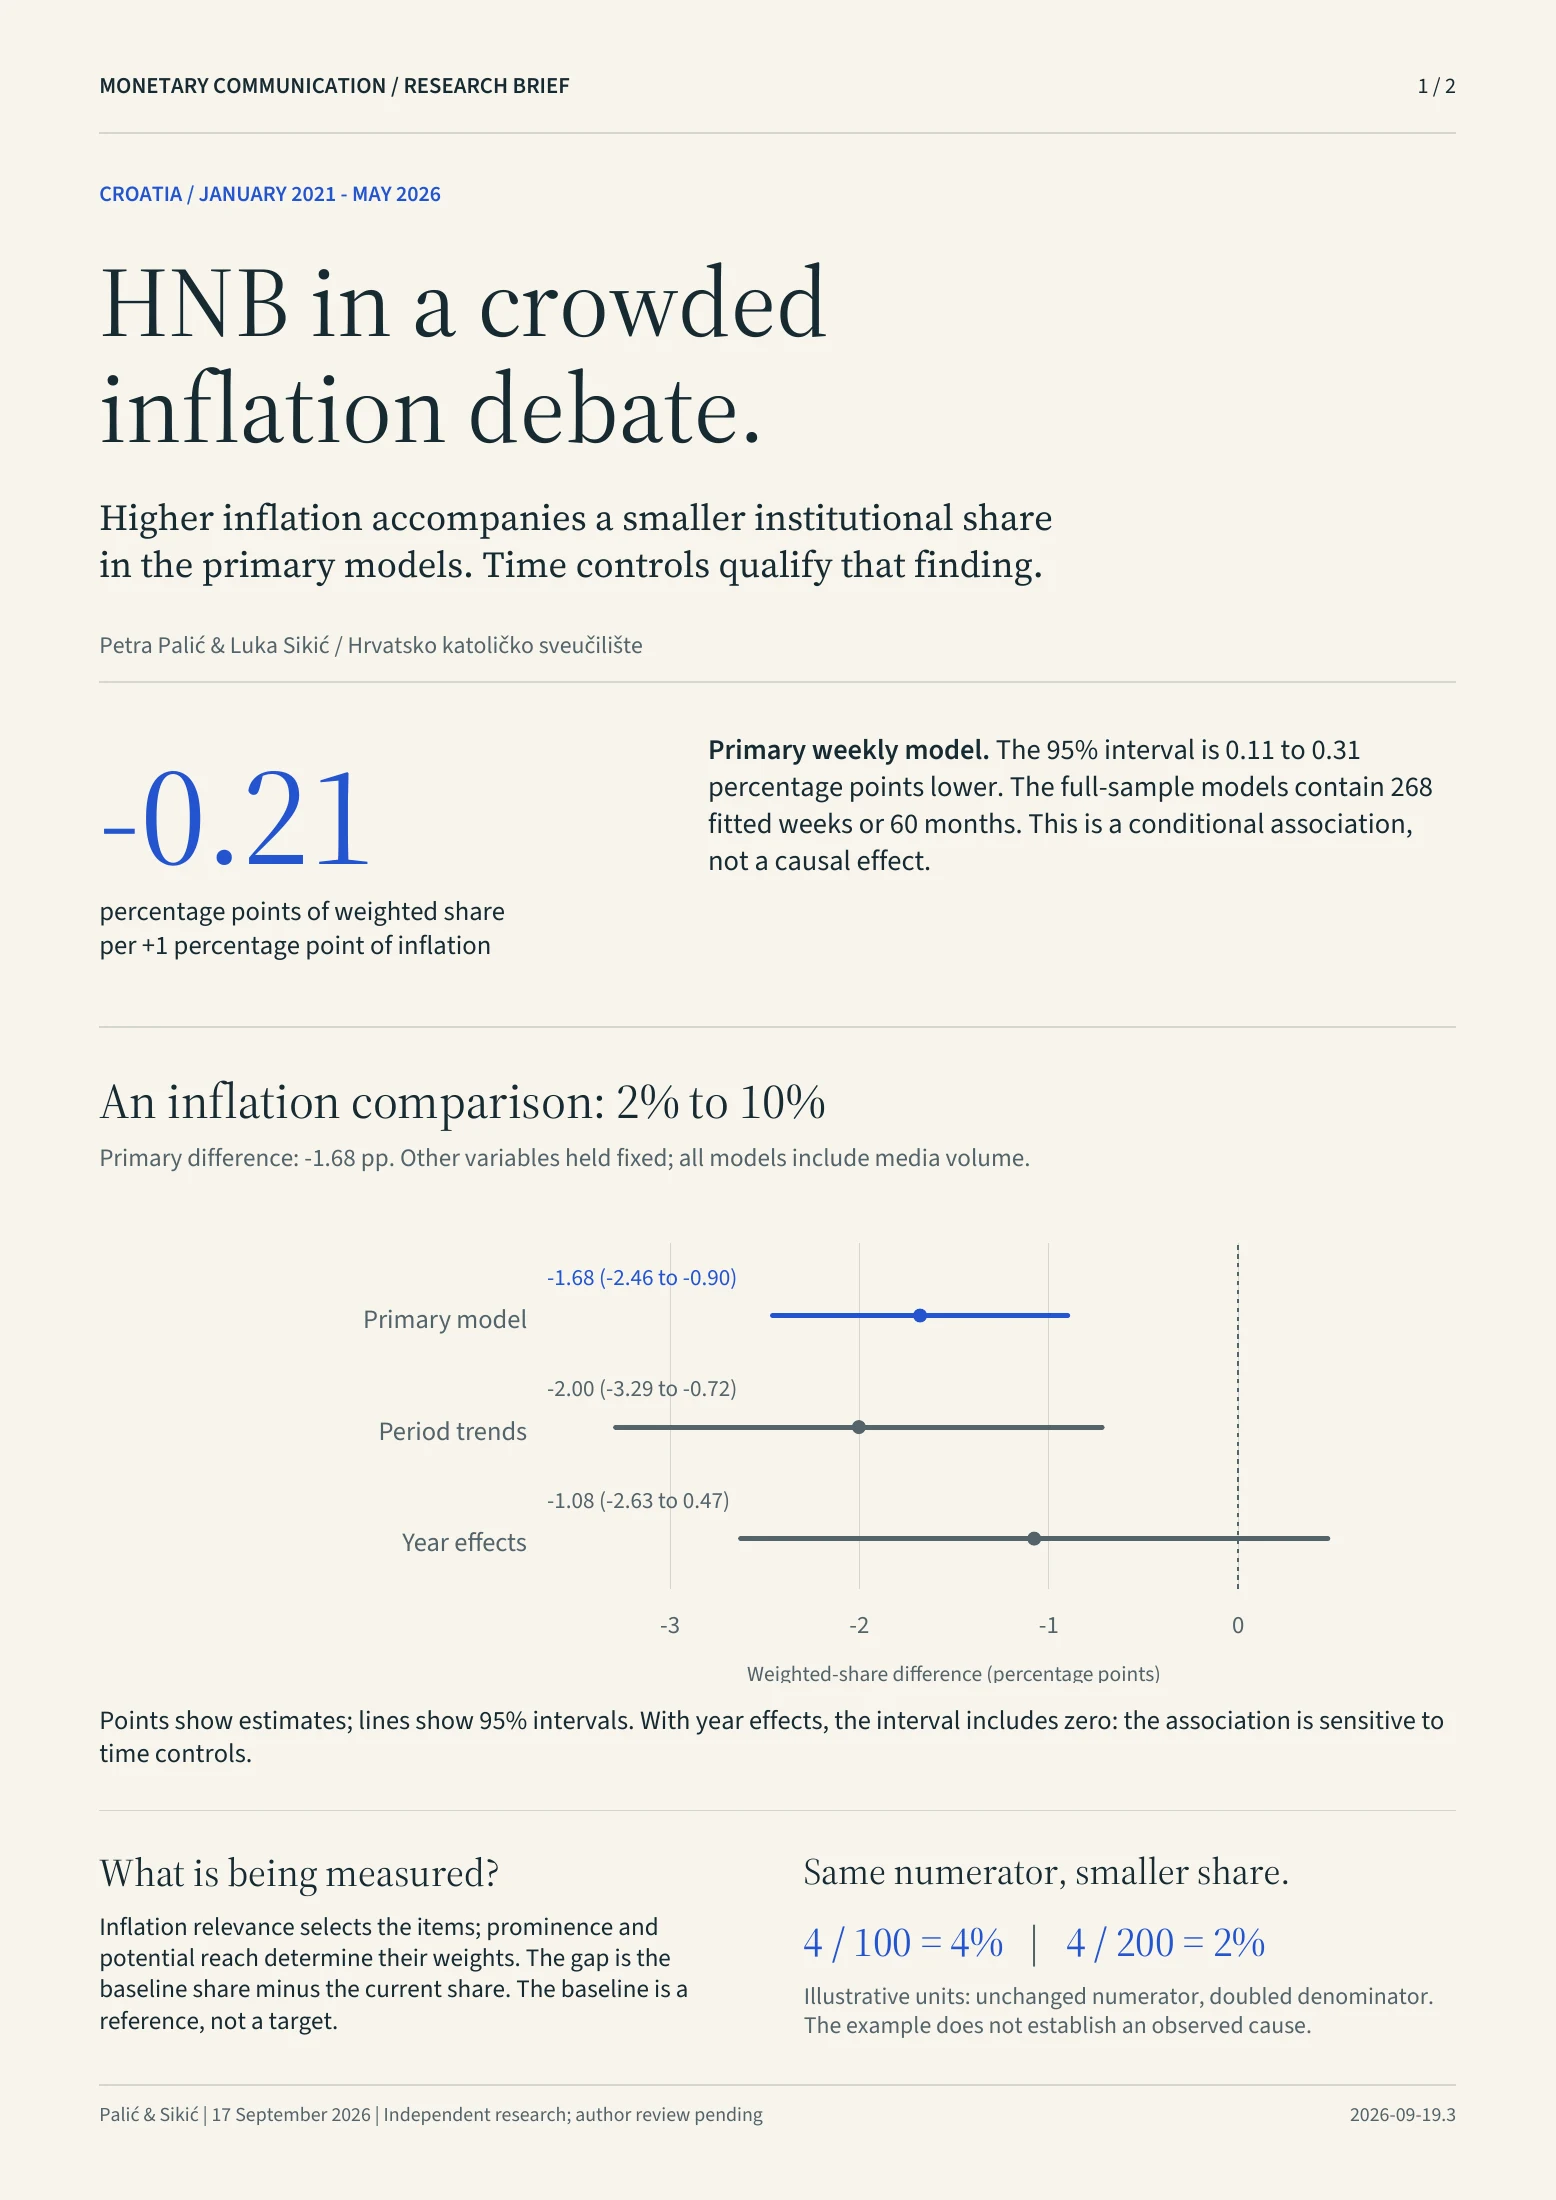
Read / copy page text
MONETARY COMMUNICATION / RESEARCH BRIEF
1 / 2
Palić & Sikić | 17 September 2026 | Independent research; author review pending
2026-09-19.3
CROATIA / JANUARY 2021 - MAY 2026
HNB in a crowded
inflation debate.
Higher inflation accompanies a smaller institutional share
in the primary models. Time controls qualify that finding.
Petra Palić & Luka Sikić / Hrvatsko katoličko sveučilište
-0.21
percentage points of weighted share
per +1 percentage point of inflation
Primary weekly model. The 95% interval is 0.11 to 0.31
percentage points lower. The full-sample models contain 268
fitted weeks or 60 months. This is a conditional association,
not a causal effect.
An inflation comparison: 2% to 10%
Primary difference: -1.68 pp. Other variables held fixed; all models include media volume.
Points show estimates; lines show 95% intervals. With year effects, the interval includes zero: the association is sensitive to
time controls.
What is being measured?
Inflation relevance selects the items; prominence and
potential reach determine their weights. The gap is the
baseline share minus the current share. The baseline is a
reference, not a target.
Same numerator, smaller share.
4 / 100 = 4% | 4 / 200 = 2%
Illustrative units: unchanged numerator, doubled denominator.
The example does not establish an observed cause.
-3 -2 -1 0
Weighted-share difference (percentage points)
Primary model
Period trends
Year effects
-1.68 (-2.46 to -0.90)
-2.00 (-3.29 to -0.72)
-1.08 (-2.63 to 0.47)
Page 2 / 2
Open full-size page ↗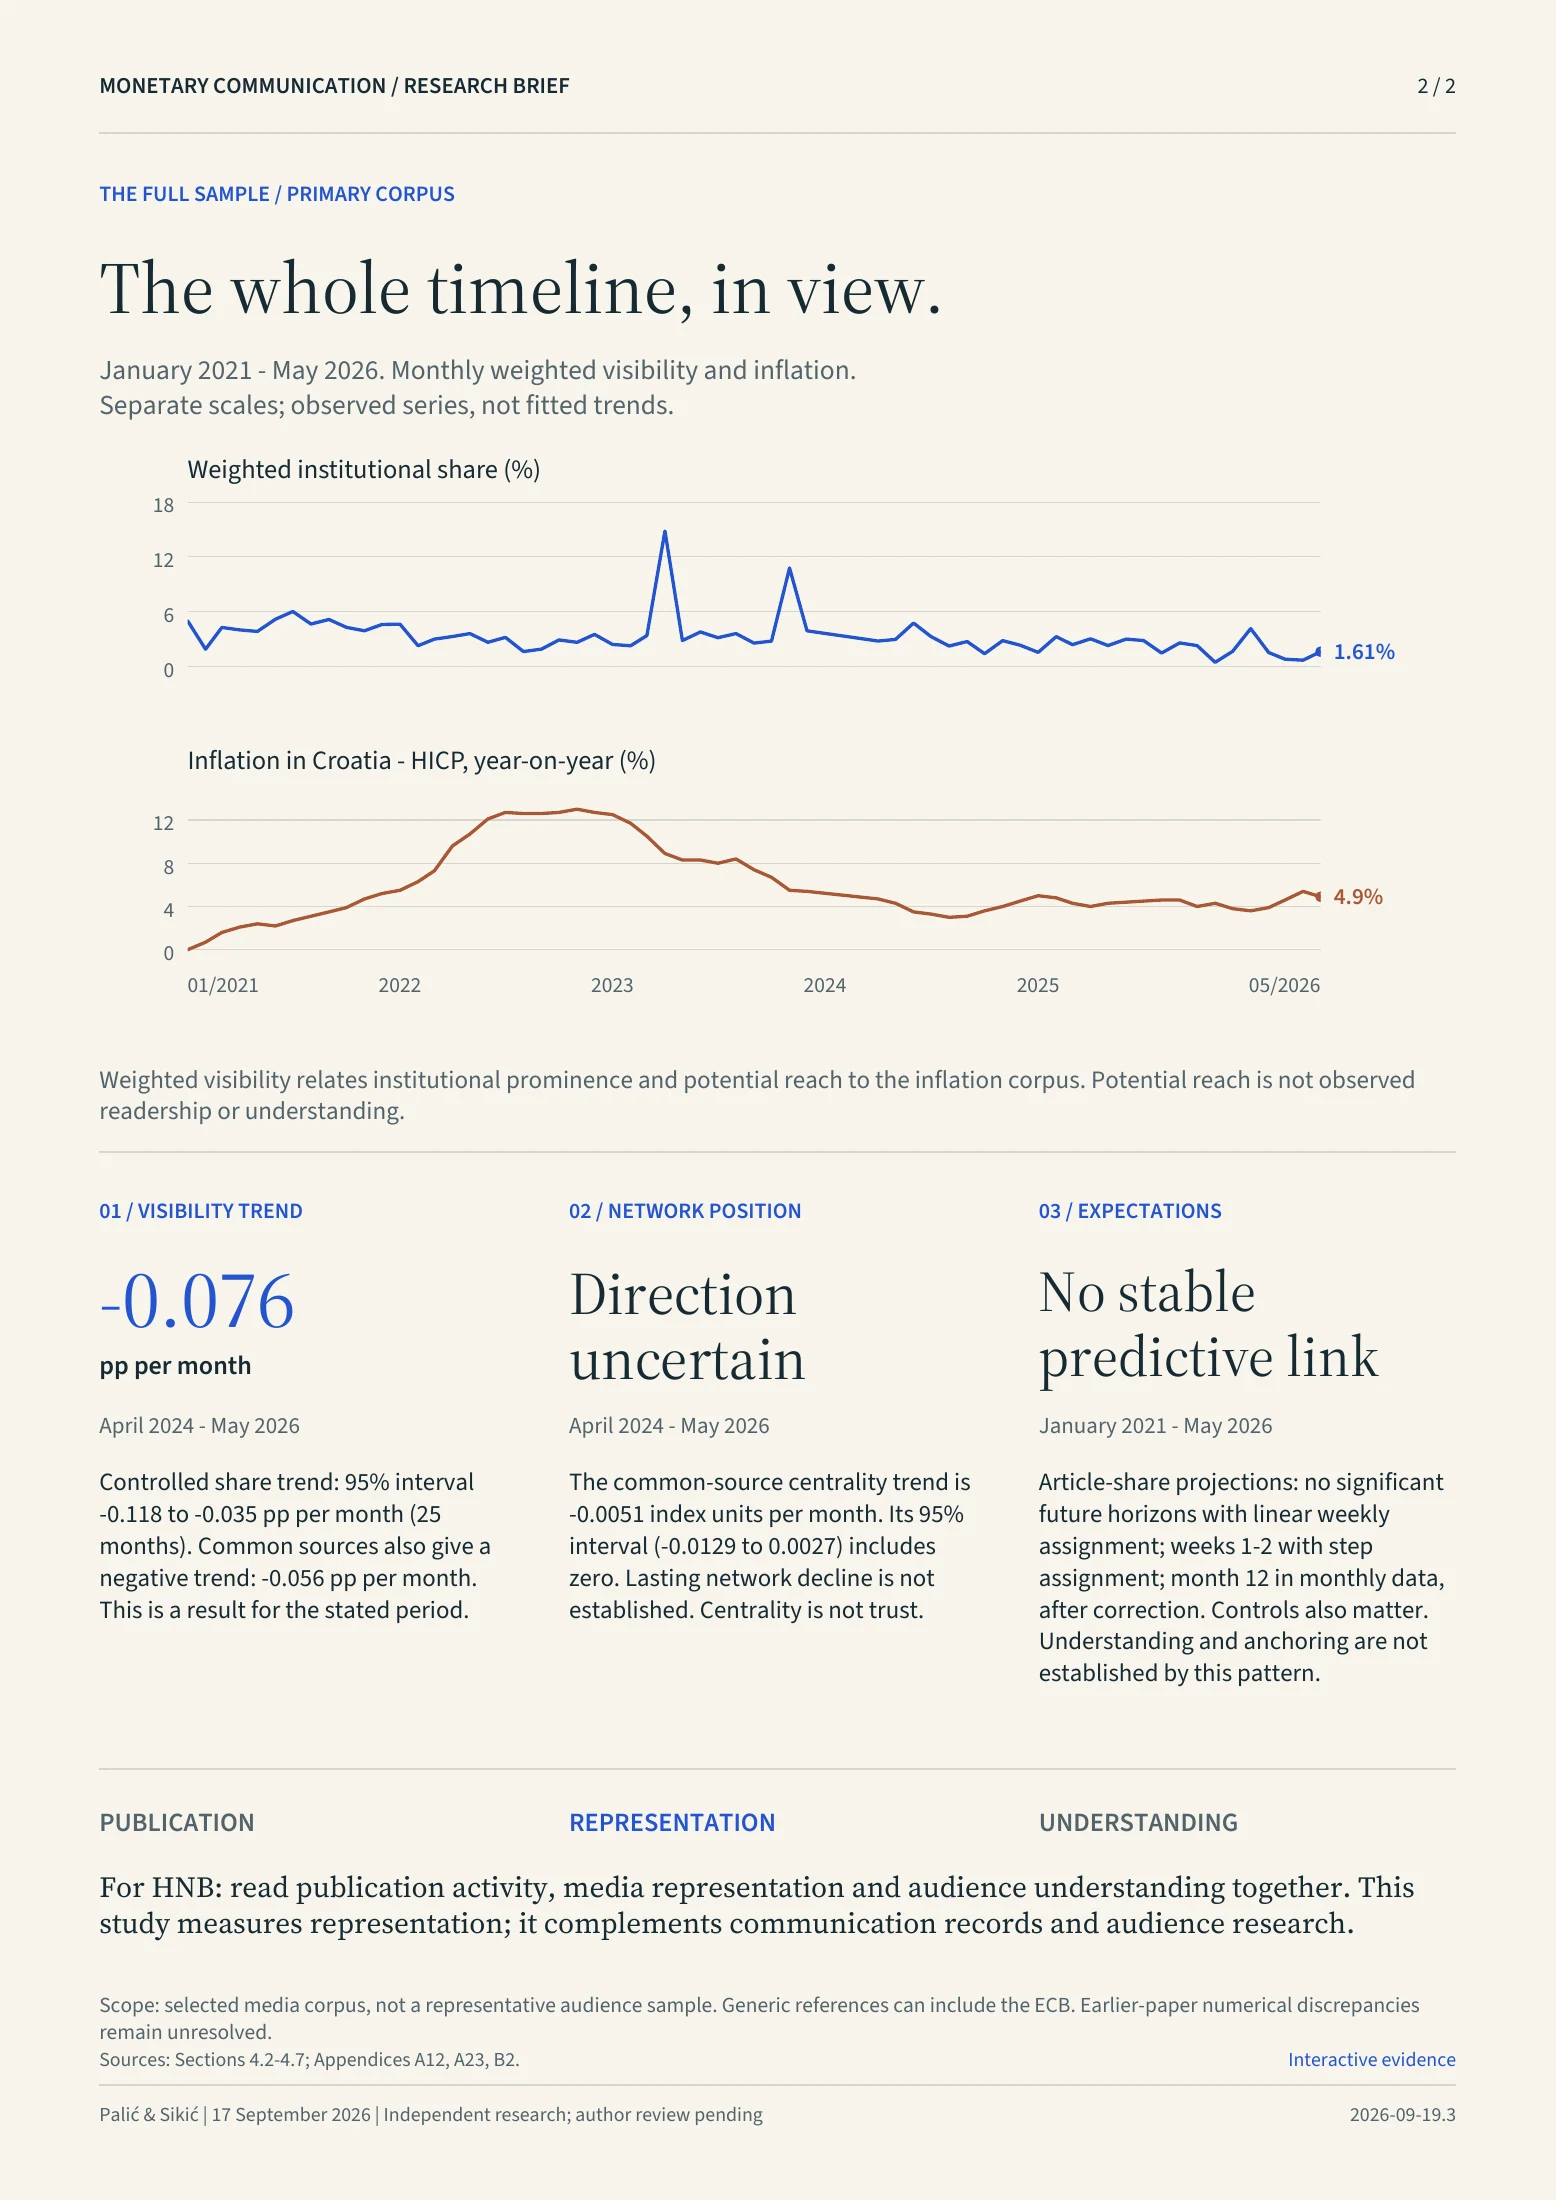
Read / copy page text
MONETARY COMMUNICATION / RESEARCH BRIEF
2 / 2
Palić & Sikić | 17 September 2026 | Independent research; author review pending
2026-09-19.3
THE FULL SAMPLE / PRIMARY CORPUS
The whole timeline, in view.
January 2021 - May 2026. Monthly weighted visibility and inflation.
Separate scales; observed series, not fitted trends.
Weighted visibility relates institutional prominence and potential reach to the inflation corpus. Potential reach is not observed
readership or understanding.
01 / VISIBILITY TREND
02 / NETWORK POSITION
03 / EXPECTATIONS
-0.076
pp per month
April 2024 - May 2026
Controlled share trend: 95% interval
-0.118 to -0.035 pp per month (25
months). Common sources also give a
negative trend: -0.056 pp per month.
This is a result for the stated period.
Direction
uncertain
April 2024 - May 2026
The common-source centrality trend is
-0.0051 index units per month. Its 95%
interval (-0.0129 to 0.0027) includes
zero. Lasting network decline is not
established. Centrality is not trust.
No stable
predictive link
January 2021 - May 2026
Article-share projections: no significant
future horizons with linear weekly
assignment; weeks 1-2 with step
assignment; month 12 in monthly data,
after correction. Controls also matter.
Understanding and anchoring are not
established by this pattern.
PUBLICATION
REPRESENTATION
UNDERSTANDING
For HNB: read publication activity, media representation and audience understanding together. This
study measures representation; it complements communication records and audience research.
Scope: selected media corpus, not a representative audience sample. Generic references can include the ECB. Earlier-paper numerical discrepancies
remain unresolved.
Sources: Sections 4.2-4.7; Appendices A12, A23, B2.
Interactive evidence
0
6
12
18
1.61%
Weighted institutional share (%)
01/2021 2022 2023 2024 2025 05/2026
0
4
8
12
4.9%
Inflation in Croatia - HICP , year-on-year (%)